
Mir Md Tasnim Alam and Dr. Anita Simic Milas
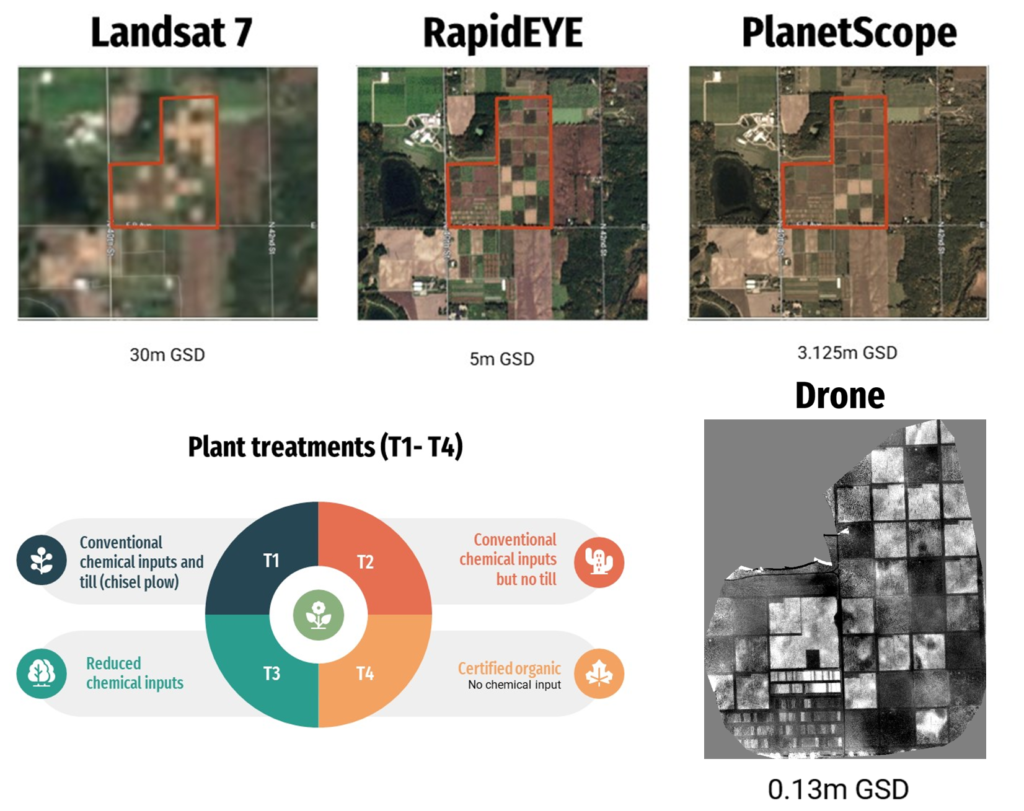
This study examines how various machine learning methods perform when combined with data fusion and a radiative transfer model (RTM). Three distinct sensors, namely Landsat-7, RapidEye, and PlanetScope, each offering varying levels of spatial and spectral resolution were employed to assess and quantify canopy chlorophyll content (CCC) from a cornfield. The objective of this research is to identify the performing sensor for CCC retrieval and identify the most effective machine-learning method for this purpose.

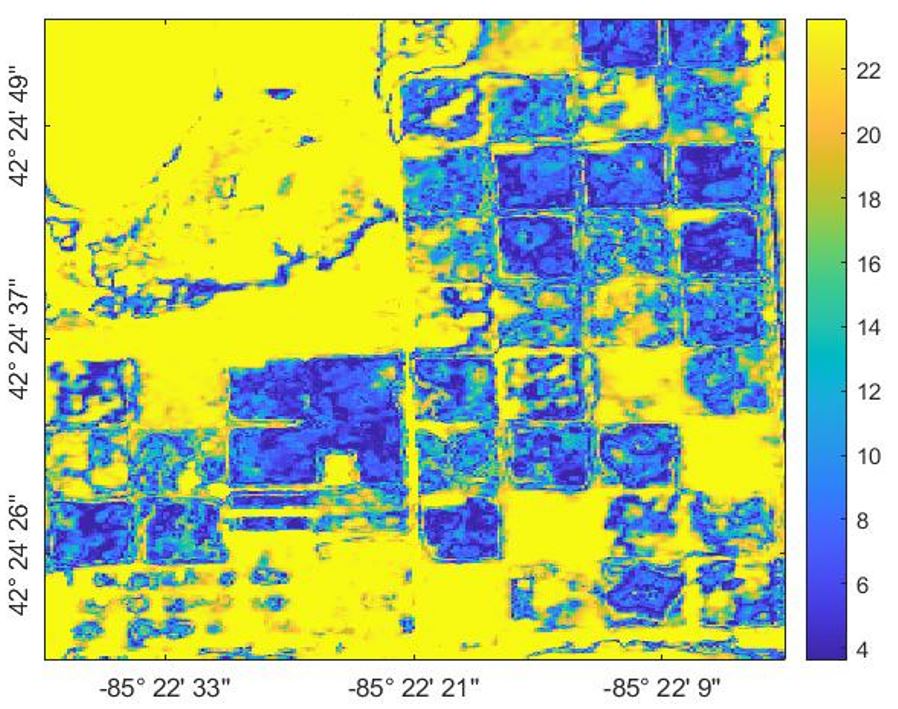
Study Area: The Kellogg Biological Station (KBS) site is in south-western Michigan, USA. The site covers an area of approximately 3,800 hectares and is situated at the coordinates 42°24’32.3″N 85°22’23.8″W
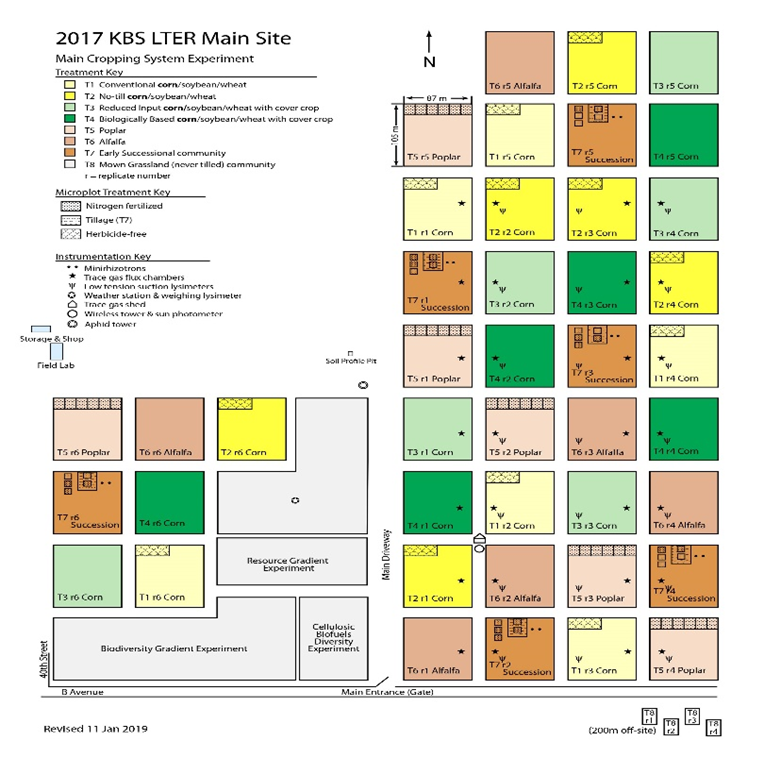
Data: The Leaf chlorophyll (LC) and leaf area index (LAI) field data were collected on August 11, 2017 from 24 plots. The satellite and drone data were collected from August 7-11, 2017. The LC was multiplied by LAI to transform it into CCC for modeling.
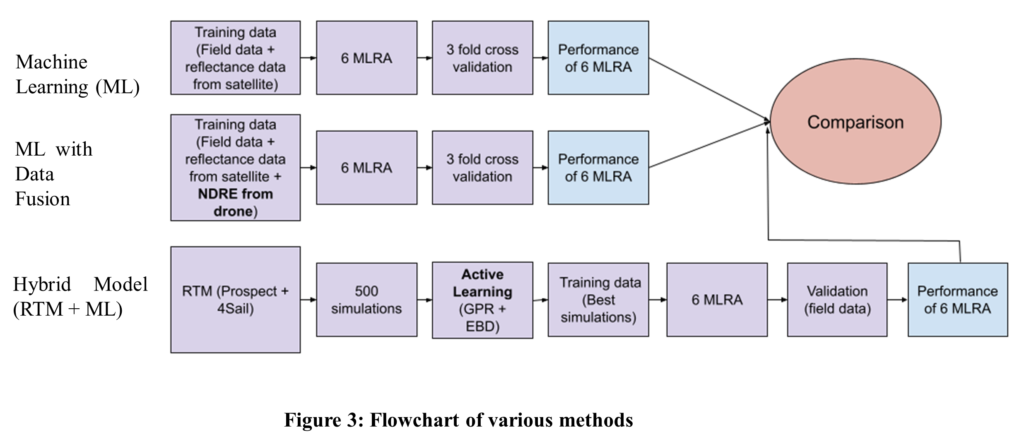
Methods: Three approaches were used to compare the sensors’ performance.
Results and discussion:
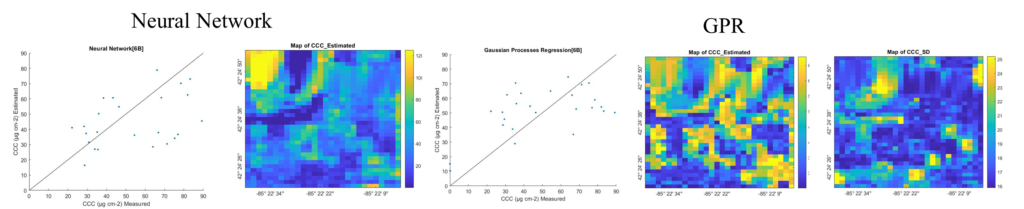
- Landsat 7
- Machine Learning
| MLRA | MAE | RMSE | RRMSE | NRMSE | R | R2 |
| Neural Network[6B] | 16.79 | 21.19 | 44.55 | 23.74 | 0.68 | 0.46 |
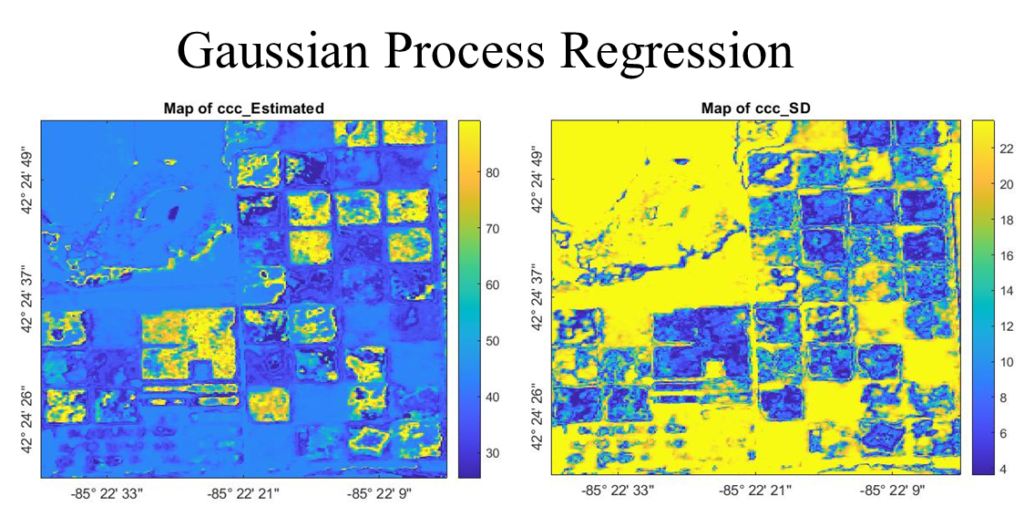
| Gaussian Processes Regression[6B] | 17.78 | 20.68 | 43.48 | 23.17 | 0.62 | 0.38 |
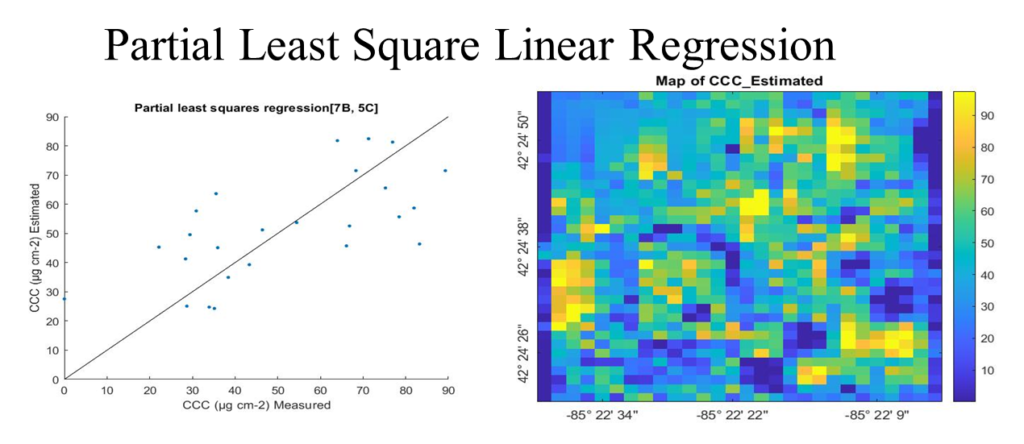
| Partial least Squares Regression [6B, 5C] | 19.23 | 22.99 | 48.32 | 25.75 | 0.59 | 0.35 |
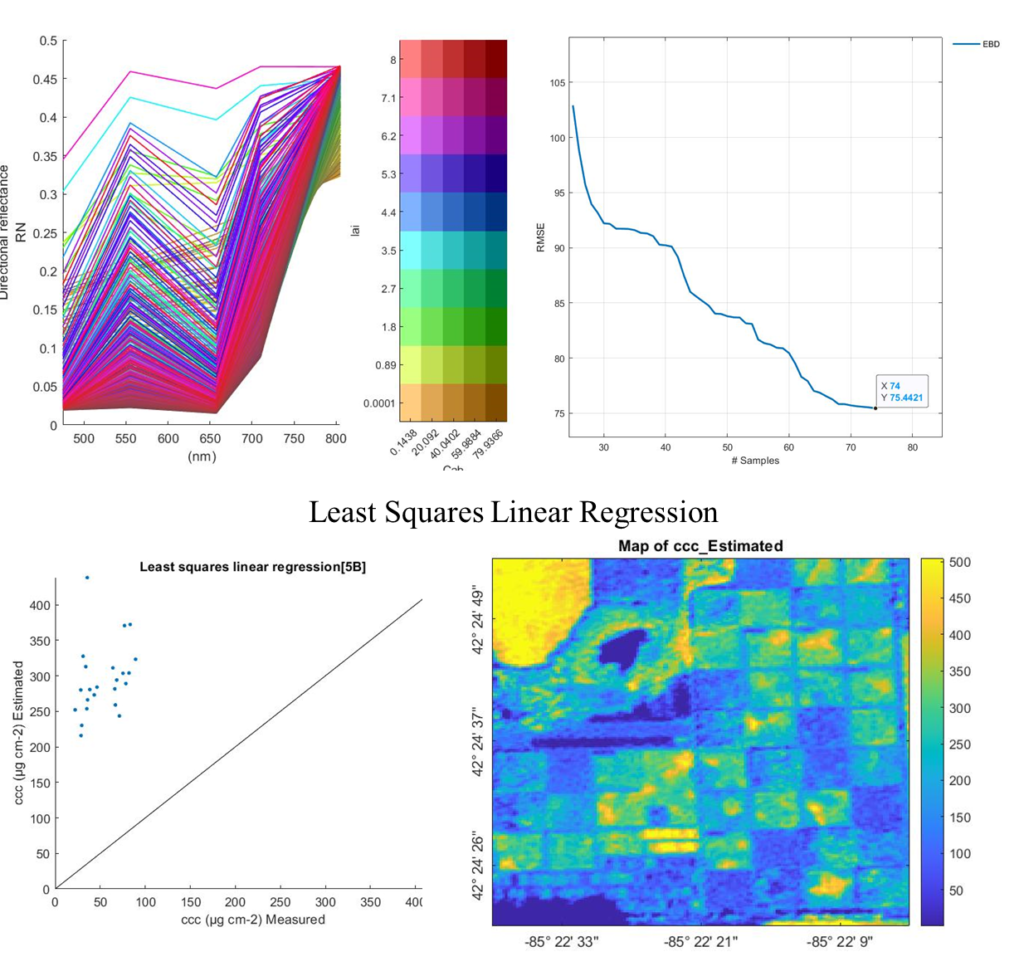
| Least Squares Linear Regression[6B] | 19.26 | 23.16 | 48.69 | 25.94 | 0.59 | 0.34 |
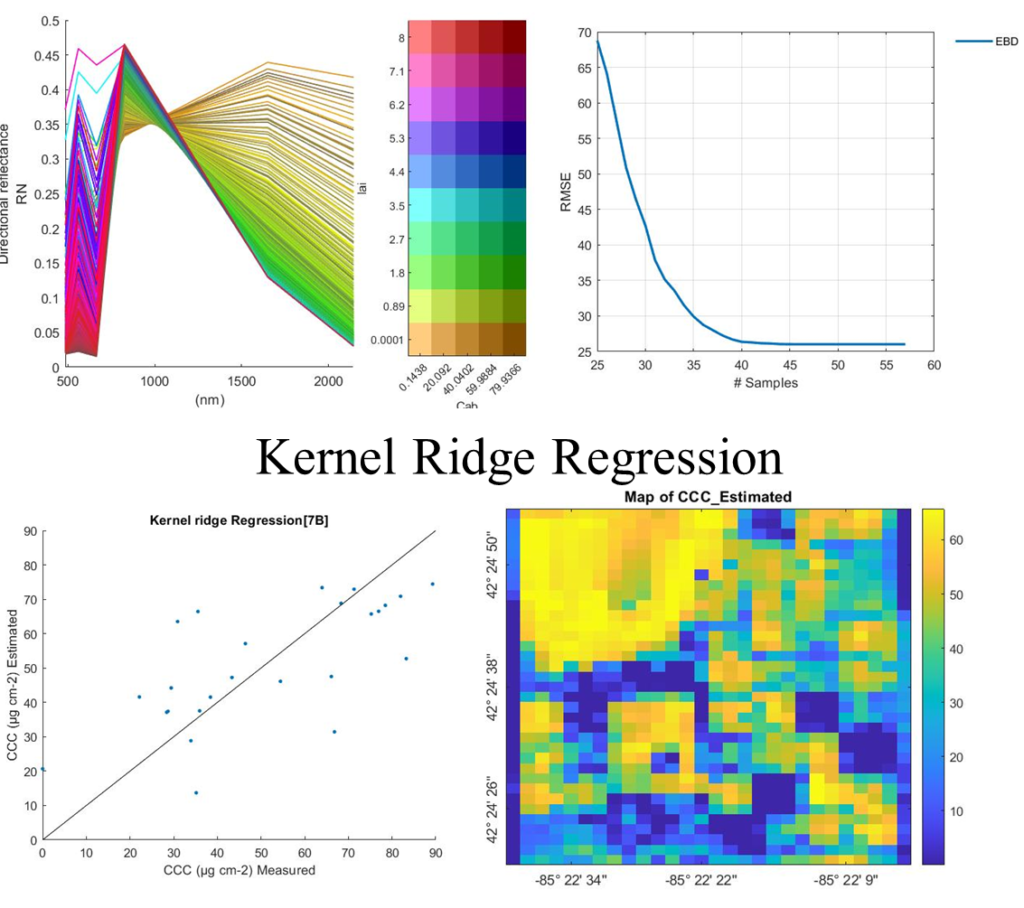
| Kernel Ridge Regression[6B] | 20.12 | 24.78 | 52.09 | 27.75 | 0.49 | 0.24 |
| K-Nearest Neighbors’ Regression[6B] | 24.84 | 30.67 | 64.47 | 34.35 | -0.08 | 0.01 |
- Data fusion
The Normalized Difference Red Edge Index (NDRE) band from the drone sensor (13 cm pixel size) was spatially modified and integrated within the Landsat 7 dataset. Six Landsat 7 bands and NDRE were used as input data into selected MLRA.
The most favorable outcome was achieved with PLSR, which yielded an R2 of 0.692. LSLR also demonstrated strong performance, with an R2 value of 0.691.
- Hybrid model (Radiative transfer model and machine learning)
500 simulations were created with Canopy RTM (Prospect 4 and 4sail). The Active Learning technique yielded 57 simulations with the lowest RMSE, utilizing a 5% RTM.
While KNNR produced the lowest R2 at 0.56, it exhibited considerably higher errors across various metrics. When considering MAE, NRMSE, RMSE, RRMSE, and R values, KRR surpassed other methods by achieving the R2 value of 0.54.
2. PlanetScope
- Machine Learning
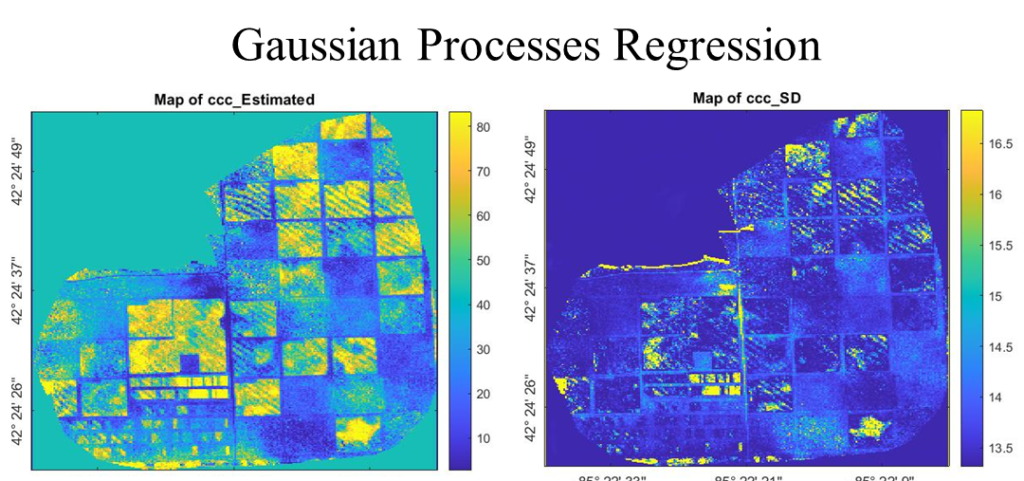
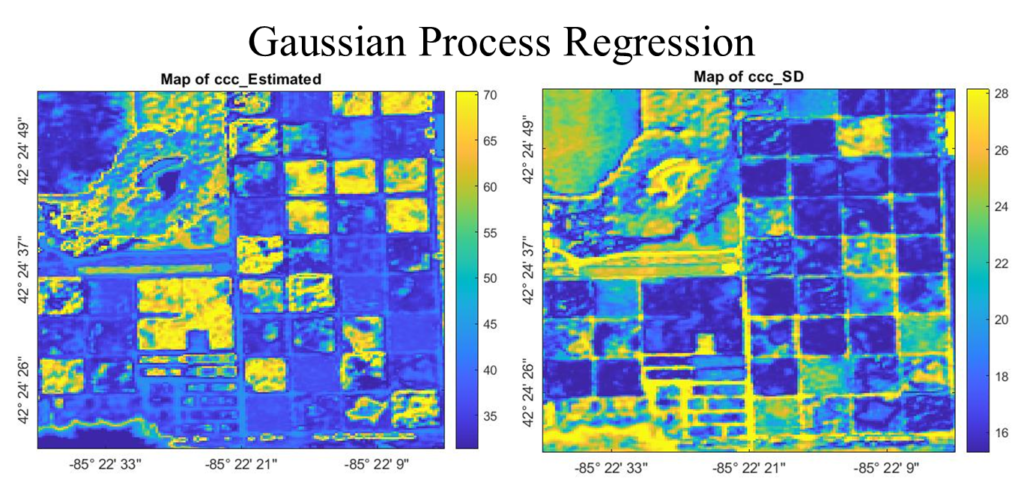
The GPR achieved the highest performance for PlanetScope satellite data, yielding an R2 value of 0.53. The other ML methods didn’t yield significant results.
- Data Fusion
The NDRE band from the drone sensor was spatially modified and incorporated within the PlanetScope dataset and utilized as input / training data.
The 3-fold cross-validation approach was applied. GPR demonstrated the highest overall accuracy, with an R2 of 0.71.
- Hybrid model (Radiative transfer model and machine learning)
Fifty-seven simulations were selected after the active learning process. The top-performing models were NN and KRR, with R2 values of 0.67 and 0.66, respectively.

3. RapidEye
- Machine Learning
GPR excelled compared to other models, achieving an R2 of 0.63. The remaining techniques did not deliver notable performance.
- Data Fusion
Data fusion wasn’t performed for RapidEye because it already has a red edge band.
- Hybrid model (Radiative transfer model and machine learning)
Seventy-four simulations were selected after the active learning process. The hybrid model did not surpass the performance of straightforward machine learning approaches. The most favorable outcome was achieved by both LSLR and PLSR, both yielding an R2 value of 0.47.
Conclusion and Summary
| Sensor Comparison Using R2 | |||||||||
| MLRA | Machine Learning | ML using data fusion | Hybrid (RTM + ML) | ||||||
| Landsat 7 | PlanetScope | RapidEye | Landsat 7 | PlanetScope | RapidEye | Landsat 7 | PlanetScope | RapidEye | |
| GPR | 0.38 | 0.53 | 0.63 | 0.66 | 0.71 | N/A | 0.45 | 0.56 | 0.38 |
| KRR | 0.24 | 0.37 | 0.45 | 0.54 | 0.63 | N/A | 0.54 | 0.66 | 0.25 |
| KNNR | 0.01 | 0.02 | 0.00 | 0.05 | 0.16 | N/A | 0.56 | 0.61 | 0.19 |
| LSLR | 0.34 | 0.40 | 0.34 | 0.69 | 0.62 | N/A | 0.42 | 0.63 | 0.47 |
| NN | 0.46 | 0.33 | 0.48 | 0.68 | 0.68 | N/A | 0.31 | 0.67 | 0.33 |
| PLSR | 0.35 | 0.43 | 0.34 | 0.69 | 0.62 | N/A | 0.28 | 0.65 | 0.47 |
1. RapidEye excels in machine learning (R2 = 0.63) due to its red edge band and finer resolution (5m).
2. Planetscope boasts the finest 3.125m resolution but lacks RapidEye’s red edge band. Incorporating NDRE via data fusion significantly enhances its accuracy (R2 = 0.71), surpassing all other methods and sensors.
3. Landsat 7 has 7 bands, but it has a spatial resolution of 30 m. Yet, data fusion can elevate Landsat 7’s performance (R2 = 0.69).
4. A hybrid model (RTM + ML) enhances accuracy when drone and NDRE data are unavailable. However, for RapidEYE, the hybrid model didn’t improve accuracy in our study.
Acknowledgment
The authors wish to extend their appreciation to the Kellogg Biological Station Long-Term Ecological Research (LTER) Program at Michigan State University for their valuable support in data collection for this research. Additionally, the authors would like to express their gratitude to Dr. Jochem Verrelst of the University of Valencia, Spain, for his generous assistance.